🇭🇰 HK Blue-Chip Daily Analyzer
Last Updated: 2026-10-31 23:34:07 HKT · Data: Yahoo Finance (yfinance, .HK daily OHLCV) · LLM layer: ENABLED
LLM interpretation layer: ENABLED — theses generated from supplied metrics only.
⚠️ Analysis based solely on price and technical data. Not investment advice.
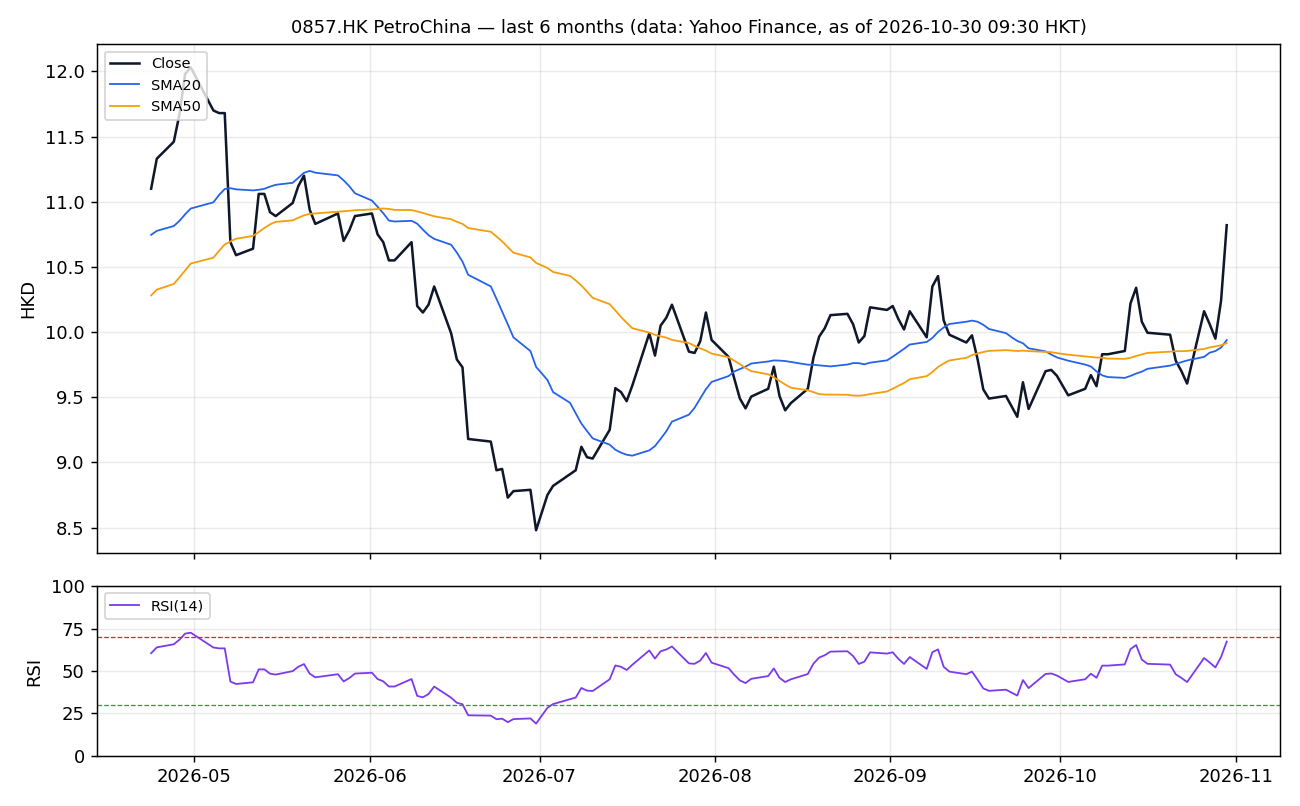
1. 0857.HK: PetroChina
Directional Bias: BULLISH (Swing 2–4 weeks)
Core Catalyst / Thesis: PetroChina trades at 10.82, up 11.43% over 1 month and 8.85% over 3 months, sitting just below its 3-month high of 10.84 and well above both SMAs (9.939/9.916). RSI of 67.4 shows firm but not exhausted momentum; with ATR at 2.96% of price, the trend has room before overbought risk becomes acute.
9.939 region (SMA20) — trend up
9.27
11.46
Risk Profile: Moderate (ATR 2.96%/day)
Supporting Data (real, code-computed):
Price 10.82 HKD · 1M 11.43% · 3M 8.85% · SMA20 9.939 · SMA50 9.916 ·
RSI14 67.4 · 3M High 10.84 · 3M Low 9.27 · ATR14 0.32 ·
Ann.Vol(1M) 37.1% · AvgVol20d 78,402,770 · as of 2026-10-30 09:30 HKT
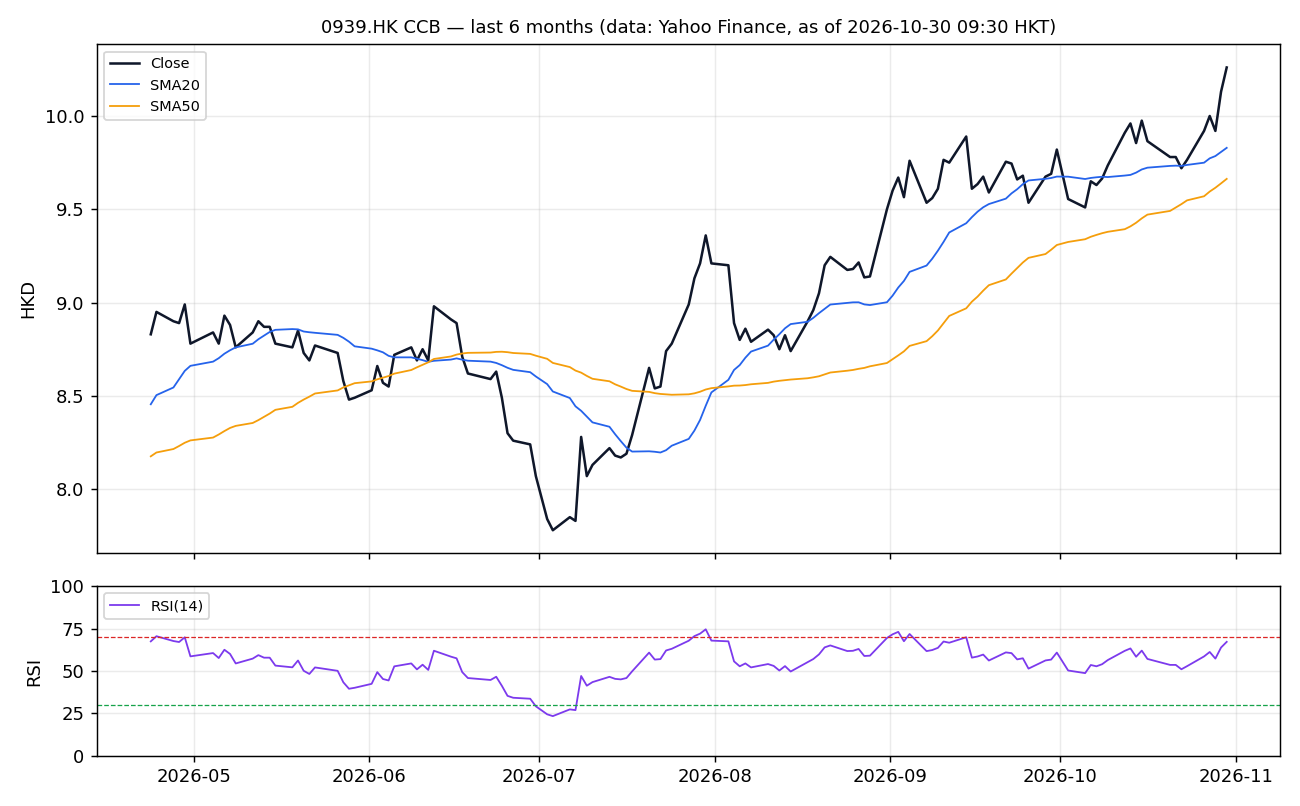
2. 0939.HK: CCB
Directional Bias: BULLISH (Swing 2–4 weeks)
Core Catalyst / Thesis: CCB at 10.26 is up 5.88% in 1 month and 11.4% in 3 months, trading near its 3-month high of 10.30 and above both SMAs (9.829/9.663) with RSI at 67.2. Low volatility (ann_vol 19.15%, ATR 1.94%) makes this a steadier uptrend relative to peers, backed by the heaviest turnover (197m shares).
9.829 region (SMA20) — trend up
8.67
10.66
Risk Profile: Low (ATR 1.94%/day)
Supporting Data (real, code-computed):
Price 10.26 HKD · 1M 5.88% · 3M 11.4% · SMA20 9.829 · SMA50 9.663 ·
RSI14 67.2 · 3M High 10.3 · 3M Low 8.67 · ATR14 0.2 ·
Ann.Vol(1M) 19.15% · AvgVol20d 197,085,947 · as of 2026-10-30 09:30 HKT
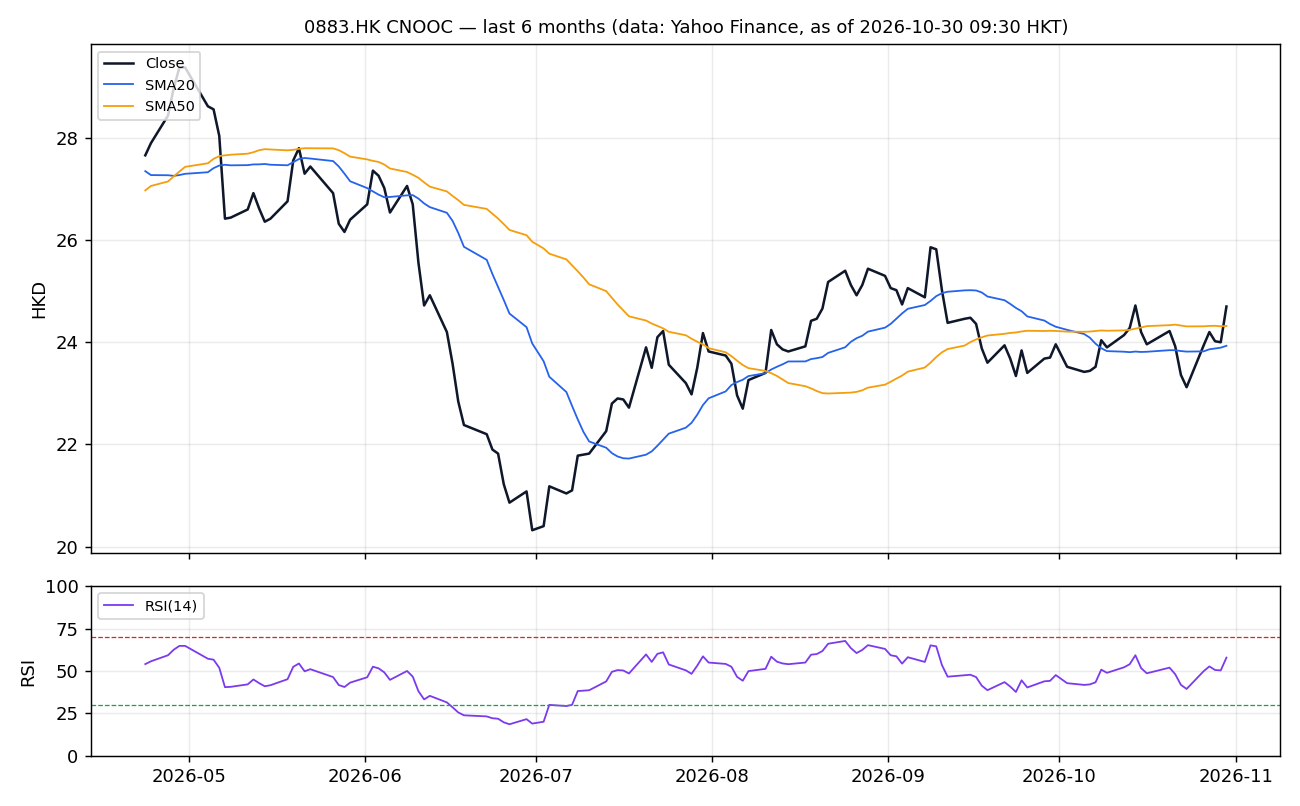
3. 0883.HK: CNOOC
Directional Bias: BULLISH (Swing 2–4 weeks)
Core Catalyst / Thesis: CNOOC at 24.70 is up 4.22% in 1 month and 3.69% over 3 months, clearing its SMA20 (23.931) though it remains below the SMA50 level of 24.318 is now reclaimed per above_sma50: true, with RSI at 57.9 leaving headroom. Price is 5% off the 3-month high of 26.0, offering trend continuation potential with moderate ATR of 2.73%.
23.931 region (SMA20) — trend up
22.52
26.05
Risk Profile: Moderate (ATR 2.73%/day)
Supporting Data (real, code-computed):
Price 24.7 HKD · 1M 4.22% · 3M 3.69% · SMA20 23.931 · SMA50 24.318 ·
RSI14 57.9 · 3M High 26.0 · 3M Low 22.52 · ATR14 0.675 ·
Ann.Vol(1M) 25.42% · AvgVol20d 75,186,366 · as of 2026-10-30 09:30 HKT
All metrics (12 stocks, real data)
| Ticker | Price | 1M % | 3M % | SMA20 | SMA50 | RSI14 | ATR% | Score |
|---|---|---|---|---|---|---|---|---|
| 0857.HK | 10.82 | 11.43 | 8.85 | 9.939 | 9.916 | 67.4 | 2.96 | 91.424 |
| 0939.HK | 10.26 | 5.88 | 11.4 | 9.829 | 9.663 | 67.2 | 1.94 | 63.353 |
| 0883.HK | 24.7 | 4.22 | 3.69 | 23.931 | 24.318 | 57.9 | 2.73 | 36.739 |
| 1398.HK | 7.895 | 3.2 | 5.13 | 7.555 | 7.56 | 63.3 | 2.37 | 34.2 |
| 1299.HK | 75.4 | 2.03 | -4.86 | 71.4 | 73.923 | 60.4 | 2.6 | 6.818 |
| 0941.HK | 80.0 | 0.82 | -4.36 | 79.142 | 79.391 | 57.0 | 1.25 | 0.352 |
| 0388.HK | 367.4 | -5.02 | -10.08 | 372.98 | 390.744 | 38.2 | 1.52 | -51.216 |
| 2318.HK | 49.74 | -5.97 | -15.19 | 50.238 | 52.984 | 40.9 | 2.05 | -67.054 |
| 9988.HK | 97.05 | -8.62 | -17.05 | 103.328 | 107.873 | 37.4 | 3.87 | -87.156 |
| 0700.HK | 383.6 | -11.2 | -19.28 | 406.61 | 425.788 | 33.4 | 2.82 | -107.179 |
| 1211.HK | 68.25 | -9.9 | -27.51 | 72.26 | 79.302 | 33.0 | 3.6 | -115.98 |
| 0005.HK | 135.7 | -14.65 | -19.32 | 144.73 | 154.916 | 29.8 | 2.46 | -128.121 |